Posts tab in Buffer Analyze
The Posts tab within your analytics dashboard provides a history of your published posts. Looking at your posts individually allows you to draw comparisons and see patterns around which posting times might be working best for you, how your boosted posts are performing, and what type of content your audience might be most engaged with.
⭐️ This feature is on our paid plans. Looking for basic analytics?
🎥 Learn more about your analytics in this video.
In this article:
- Adding metrics to a custom report
- Facebook metrics
- Instagram metrics
- X/Twitter metrics
- LinkedIn metrics
- Related articles
Finding your report
- Start by clicking Analytics on the left side of your Buffer dashboard (not available on mobile).
- Select the channel you'd like to analyze on the left-hand side of your dashboard.
- Choose a profile or Page from the drop-down.
- Click Posts.
- Choose the date range you'd like to view.
Diving into your report
Summary table
The summary table shows aggregate metrics for all posts published during the selected date range. We'll show you impressions, reach, users, comments, and your engagement rate.
Buffer's analytics dashboard also shows you insights for boosted Facebook posts or promoted Instagram posts. Learn tips on which posts to boost and how to best measure your results in our blog post here!
Organic posts and boosted posts are represented by blue and green respectively in the bar chart.
The percentages indicate any change in metrics compared to the previous period. So, for example, if you have the last 7 days set as your date range, the percentage change will be a comparison to the previous 7-day period before that.

📝 If you’re not seeing boosted posts data, it could be because you need to allow permission for this. Learn more in the article: Why isn't my ad data displayed on boosted posts?
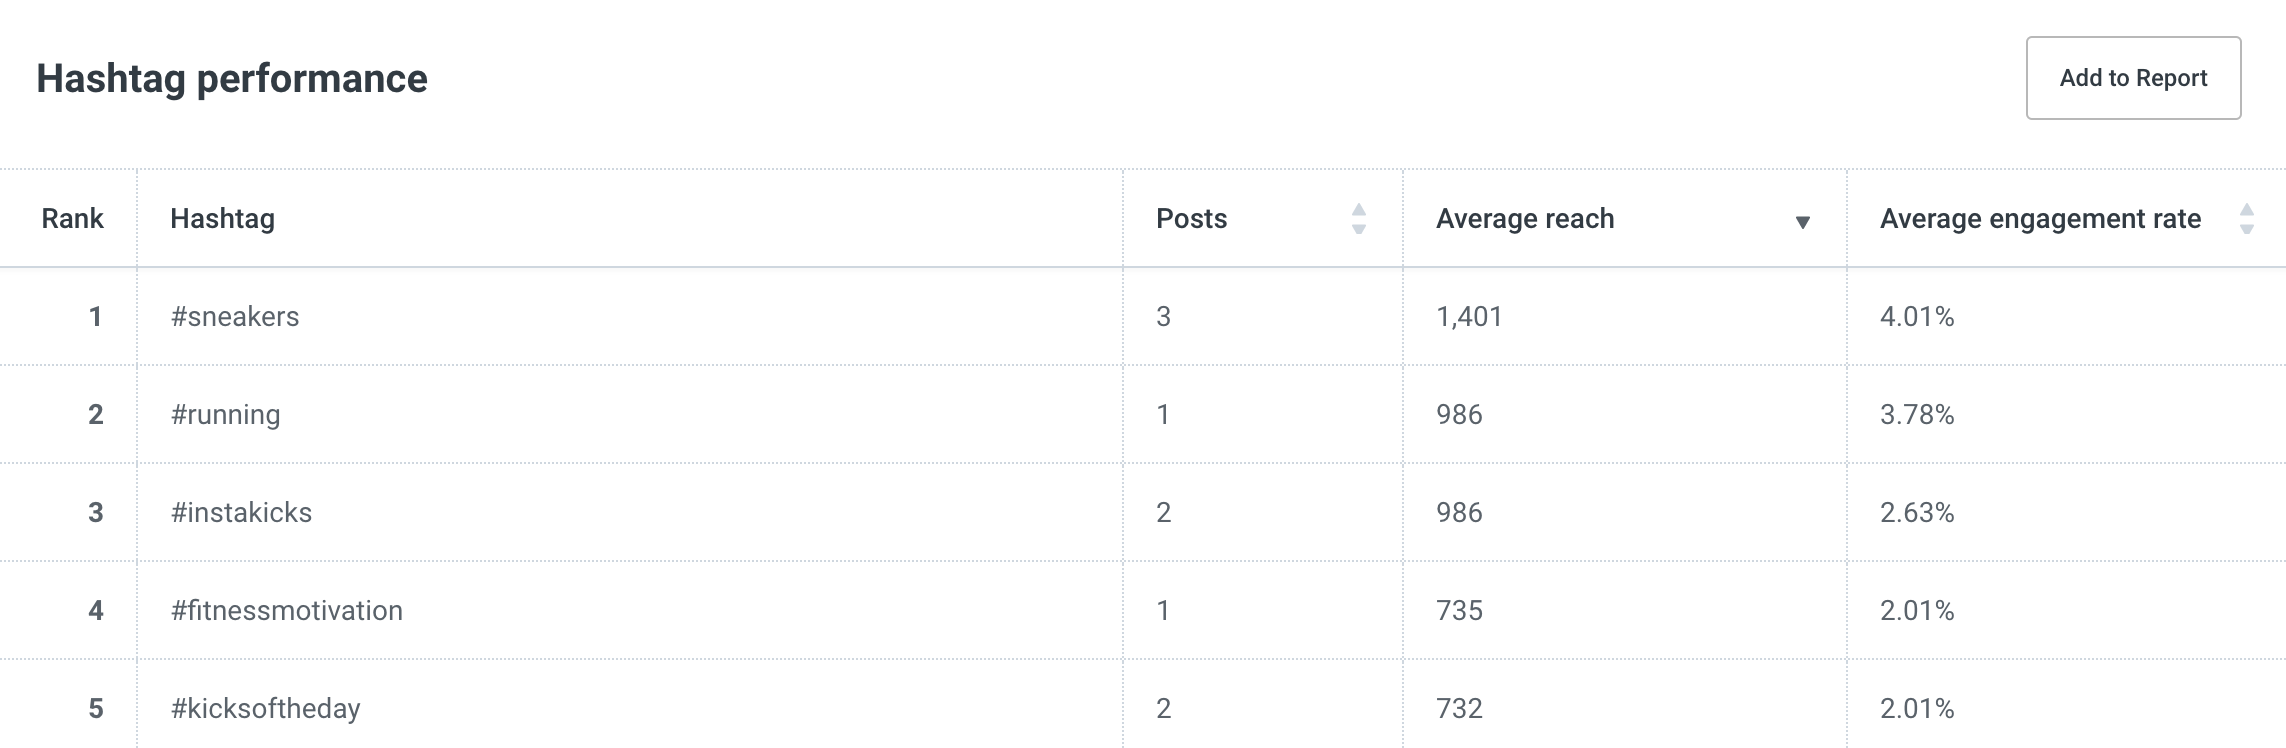
Hashtag performance table
The hashtag performance table provides insight into how your hashtags could be affecting your reach and engagement rates. You can use this information to inform your posting strategy by looking at posts with hashtags that are associated with the highest reach and engagement rates. At the moment, only the top five hashtags that had the most engagement in the date range selected are shown in this table.
📝 Hashtags included in both the main caption of the post and the first comment are shown in this table. The average reach and average engagement rate for your hashtags are based on your organic posts only. They do not include the additional reach and engagement from boosting. Additionally, for LinkedIn and X/Twitter, we show your average impressions because their APIs do not provide the reach metric.
Posts insights
The posts insights table shows you all of your published posts, sorted by impressions in descending order by default. You can filter posts by keywords and hashtags, as well as sort them either by date or another metric. The post time shown is in your browser timezone.
For every post that was boosted, you can easily see the proportion of organic and paid results. You can also hover over the bar charts to see the exact breakdown.
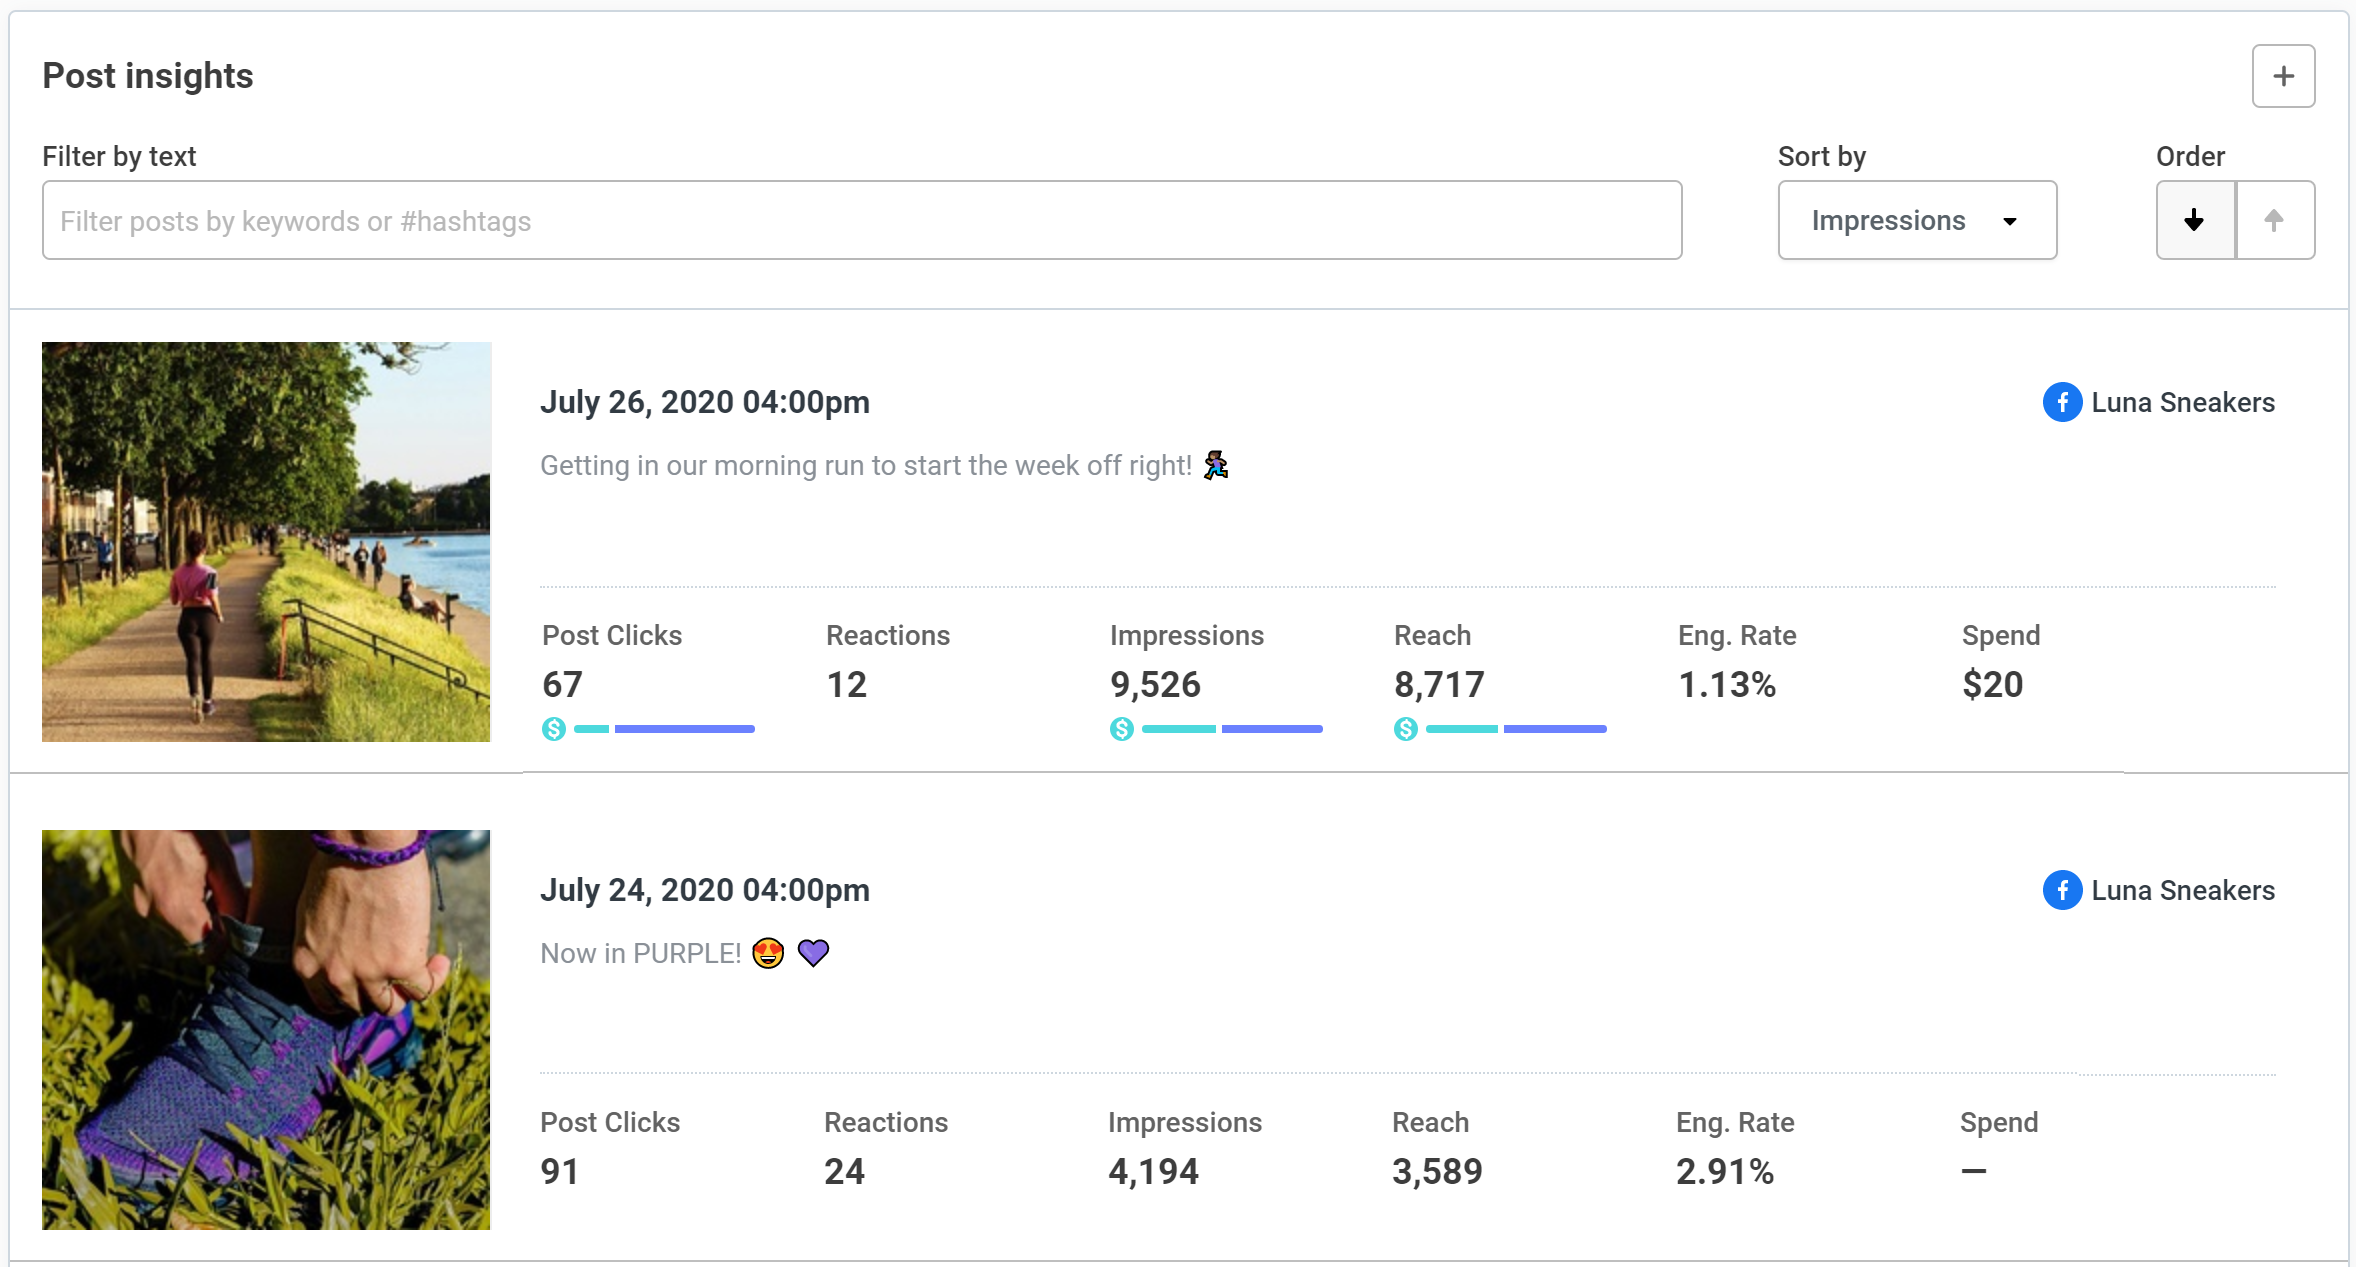
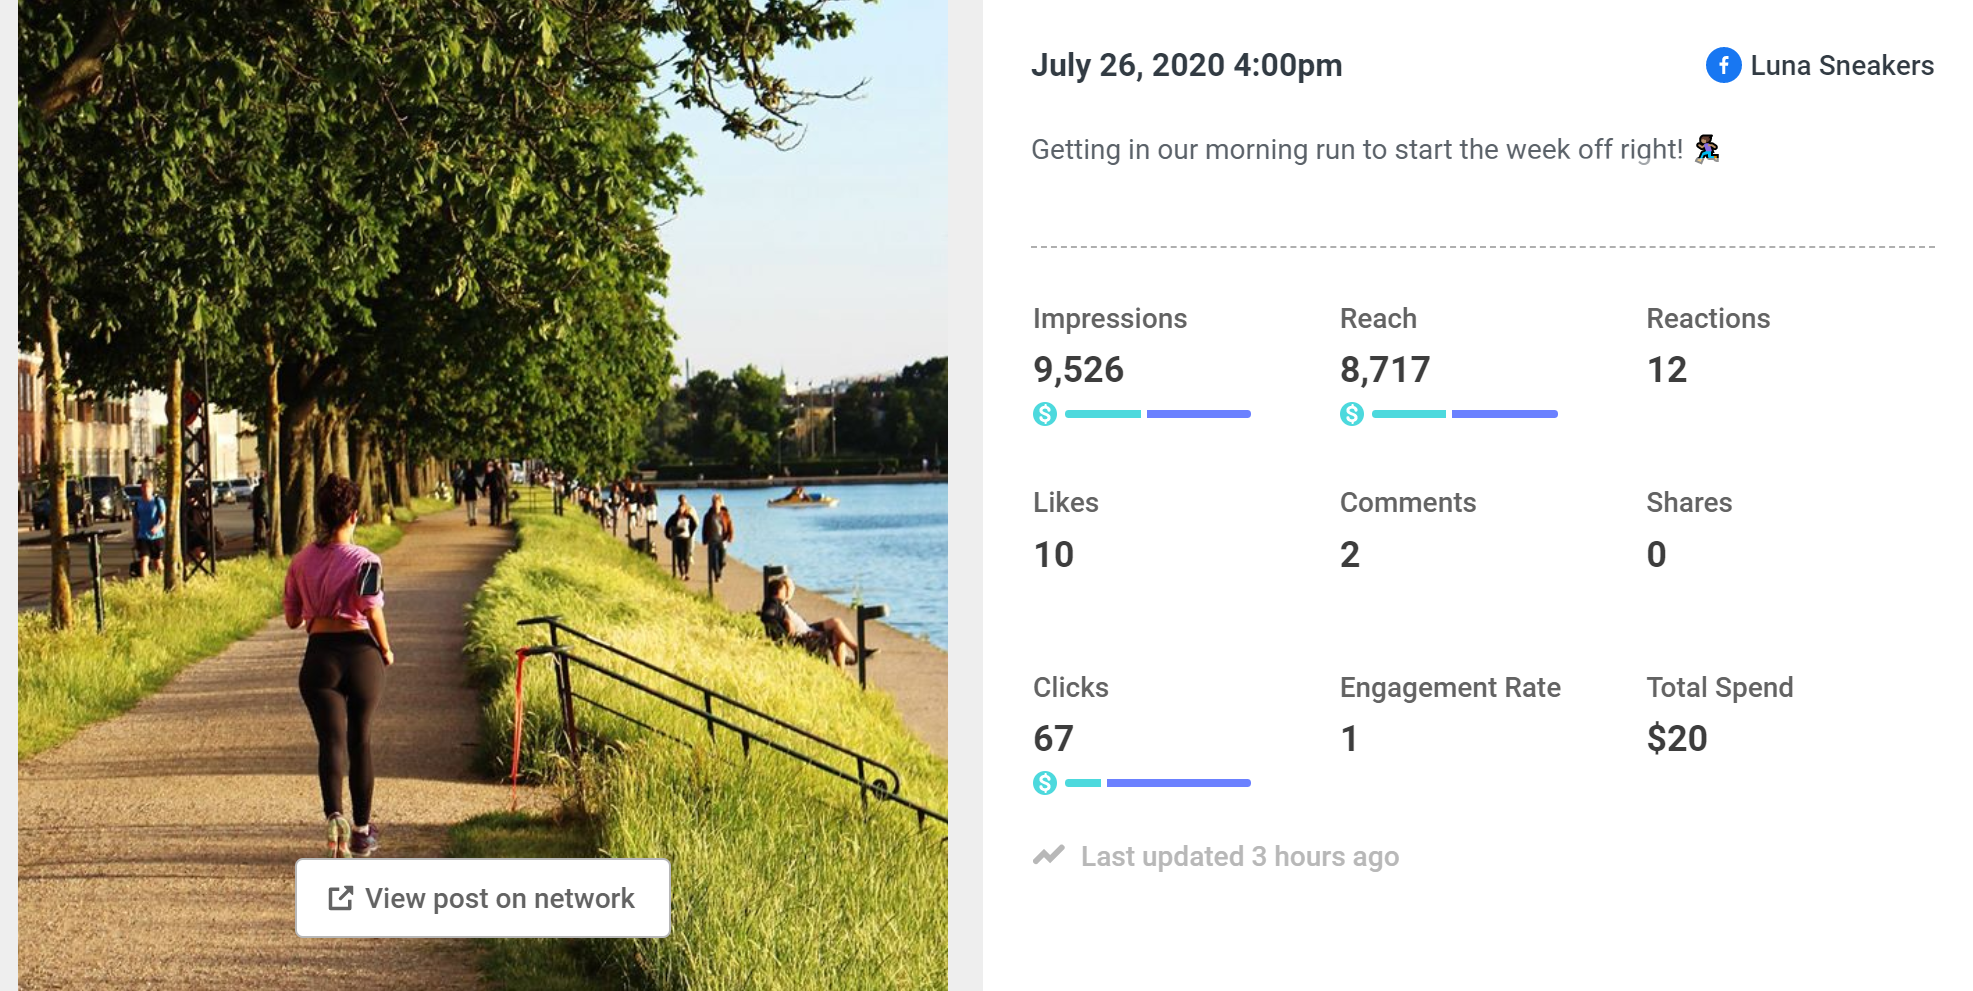
The post insights table only shows the five key metrics of each post. To see the remaining metrics, click on the image. Within this window, you can hover over the respective bars to see the exact breakdown between organic and paid.
📝 If a post has been published and later edited or deleted, the original post will appear in your analytics dashboard and not the edited version.
Adding metrics to a custom report
Finally, you can add any of the tables and charts from this area to a custom report. Simply click the ➕ plus button at the top right of any chart you'd like to include. Learn more about creating custom reports here.
You can also export all data as both CSV and image files using the Export as... button.

Facebook metrics
The table below provides an overview of which metrics are available in each table and chart. Find Facebook metrics descriptions here. All metrics are pulled from Facebook's Graph API.
| Summary table | Hashtag performance table | Posts insights table | |
| Posts | ✓ | ✓ | |
| Reactions | ✓ | ✓ | |
| Comments | ✓ | ✓ | |
| Shares | ✓ | ✓ | |
| Engagement Rate | ✓ | ✓ | ✓ |
Instagram metrics
The table below provides an overview of which metrics are available in each table and chart. Find Instagram metrics descriptions here. All metrics are pulled from Instagram's Graph API.
| Summary table | Hashtag performance table | Posts insights table | |
| Posts | ✓ | ✓ | |
| Reach | ✓ | ✓ | ✓ |
| Impressions | ✓ | ✓ | |
| Likes | ✓ | ✓ | |
| Comments | ✓ | ✓ | |
| Engagement Rate | ✓ | ✓ | ✓ |
X/Twitter metrics
The table below provides an overview of which metrics are available in each table and chart. Find X/Twitter metric descriptions here. All metrics are pulled from Gnip, which is X/Twitter’s enterprise data service.
| Summary table | Hashtag performance table | Posts insights table | |
| Posts | ✓ | ✓ | |
| Impressions | ✓ | ✓ | |
| Clicks | ✓ | ✓ | |
| Likes | ✓ | ✓ | |
| Replies | ✓ | ||
| Reposts | ✓ | ✓ | |
| Engagement Rate | ✓ | ✓ | ✓ |
LinkedIn metrics
The table below provides an overview of which metrics are available in each table and chart. You can find a detailed description of each metric here. All metrics are pulled from LinkedIn's Marketing Analytics APIs.
| Summary table | Hashtag performance table | Posts insights table | |
| Posts | ✓ | ✓ | |
| Impressions | ✓ | ✓ | ✓ |
| Likes | ✓ | ✓ | |
| Comments | ✓ | ✓ | |
| Shares | ✓ | ||
| Clicks | ✓ | ✓ | |
| Engagement Rate | ✓ | ✓ | ✓ |
Related articles
Overview tab in Buffer Analyze
Why are my stats different between the posts tab and the overview tab