Using Insights in Buffer
Want to know how your content is landing without diving into a full analytics report? Insights has you covered. It's a lightweight analytics view built right into Buffer — check in on a single channel's follower growth, engagement, and impressions, or get a cross-channel overview of how all your channels are performing, all without ever leaving your publishing dashboard.
⚠️ Insights is available in Beta on the Buffer web app only. We hope to make it available in the mobile apps soon! Learn more about how to test Buffer's Beta features here.
- Google Business Profiles are not supported in Insights due to API limitations.
In this article:
- Video: How to Get the Most Out of Your Buffer Insights
- Why use Insights?
- How to access Insights
- Filtering Insights
Video: How to Get the Most Out of Your Buffer Insights
Watch the video below to learn more about Buffer's Insights feature, including both ways to access them:
- All channel metrics aggregated for a birds-eye view, and
- Individual channel insights with our AI-powered Takeaways feature!
Why use Insights?
- Stay in your workflow. Key performance data lives right inside Buffer — no need to jump to a separate analytics dashboard.
- Get a quick pulse-check. See how a channel is trending at a glance before you plan your next post.
- Check in on a single channel or all at once. Drill into one channel's performance or zoom out to see how all your channels are doing from the All Channels view.
- See what's working at a glance. Compare your current numbers against the previous period, the same period last month, or the same period last year — handy for tracking seasonal trends.
- Find your best posts fast. The Performance per Post table ranks your content by engagement rate so you can spot what's resonating and do more of it.
- Watch your audience grow. The Metrics chart makes it easy to visualize follower growth and other key stats over time, or break growth down by channel to see where it came from.
- Make smarter content decisions. With reach, impressions, and engagement rate at your fingertips, you always have clear insights to guide your next steps.
- Turn insights into posts in one click. "Start with AI" takeaways open the composer with an AI prompt already filled in, based on what's been working for you.
How to access Insights
There are two ways to access Insights:
For All Channels - Click Insights in the left sidebar of the web dashboard. Here, you'll see an overview of your Insights across all channels.
For a specific channel - In the left sidebar, select the channel you'd like to view and then click Insights beneath the channel name.

You'll land on the Insights dashboard for that channel. It defaults to the last 30 days, but you can adjust the date range using the options at the top of the page.
Available date ranges:
- Last 7 days
- Last 30 days
- Month to date
- Last month (paid plans only)
- Custom (paid plans only)
When you select Custom, you'll see a search box in the date picker that accepts natural-language queries. You can type:
- A specific month, e.g.
April 2026orApril - A relative range, e.g.
last 7 days,last 30 days,last 365 days - A month-to-month range, e.g.
April to May 2026,April 2026 - May 2026, orApril - May 2026
If Buffer can't understand what you've typed, you'll see a small message below the search input suggesting examples. The message clears as soon as you keep editing your query or pick a supported format.
💡 Tips:
- The Custom date range is handy for tracking specific campaigns — great for reviewing how a product launch or seasonal push performed.
- The Custom date range and Last month is available on Essentials and Team plans. Free plan Insights includes Last 7 days, Last 30 days, and Month to date.
- You can save any combination of date range and comparison as a named view — including the default Last 30 days, Month to date, Last month, Last 7 days, and Custom. Look for the bookmark icon next to the filter controls. Reopening the saved view restores both the date range and any comparison you had set.
💡 No data for the selected period? If there are no posts or no metrics available for your selected date range, Insights will show a "No Data Found" message in the chart. Try widening your date range or switching to a period when you were actively posting. If you've just connected a channel, data may take a short time to populate.
Filtering Insights
Both Tags and Channels filters are available in the All Channels view, making it easy to narrow down your Insights to just the posts or channels you care about. If you're viewing a single channel, you can still filter by Tags to focus on specific content categories.
Filter by Tags:
- In the top right of the Insights dashboard, click Tags.
- A dropdown will appear with a search bar and a list of your available tags.
- Check one or more tags to filter your Insights to only posts that have those tags applied. You can also search for specific tags or select Untagged to see posts without any tags.

Filter by channel (All Channels view only)
The channel filter at the top of the Insights page drives every section on the page, including the Metrics chart. There's no separate in-chart channel picker.
- In the top right of the Insights dashboard, click Channels.
- A dropdown will appear with a searchable list of your connected channels.
- Check one or more channels to narrow Insights down to just those channels. You can also use Select all to include everything, or search by channel name to find one quickly.

💡 Tip: Tags and Channel filters can be used together so you can see how a specific content category performed across a subset of your channels.
📝 Note: Insights doesn't support every channel type. Facebook Groups, Instagram personal profiles, and Start Page are greyed out in the channel filter and excluded from Insights data and exports. If a channel group contains only unsupported channels, the whole group is disabled too. To see these channels' data, head to their native dashboards.
Exporting your Insights
⭐ Exporting Insights data is available on our paid plans. Learn more about our our plans and pricing here.
You can export your Insights data at any time, either from a single channel view or the All Channels view. The export reflects exactly what you're currently seeing on the page, including your active date range, tag filters, and channel filters.
How to export your Insights data
- Open Insights on the left side panel (either for a specific channel or the All Channels view).
- Set the page up the way you want it before exporting. The export captures exactly what's on screen, including:
- Date range, Tags, and (in All Channels) Channels filters
- The active sort on the performance and Top Posts tables — for example, sorting All Channels by engagement rate will reorder the PDF's channel summary, the per-channel detail sections, and the top-25 channel cap to match
- The columns you've kept in the column picker on the single-channel Top Posts table and the All Channels performance table
📝 Notes on column selection in PDF and CSV
- PDF exports show up to 6 metric columns at once, so the layout stays clean and readable. If you've selected more than 6, you'll see the first 6 in your chosen order, plus a note showing how many of your selected columns made the cut.
- CSV exports include all your chosen metric columns in order, followed by a Statistics column with everything else, so no data gets left out.
- Click the Export button at the top of the page, near the date range and filter controls.
- Choose your format:
- Export to CSV — downloads a
.zipfile containing three separate CSV files:summary.csv,posts.csv, andtimeseries.csv. Great for spreadsheets, client reports, and custom analysis. - Export to Markdown — downloads a single
.mdfile with all three sections. Great for pasting into reports, docs, or AI tools. - Export as PDF — opens a short configuration step first, where you can set a custom report name, upload a cover logo, and choose which sections to include (see Customizing your PDF export below). Buffer then generates a branded PDF report of your current Insights view.
- For the All Channels view, the export includes an aggregated Summary, Top 5 Posts by Reactions, Top 5 Posts by Comments, a per-channel Performance table, and a detailed section for each channel with its own Summary metrics, charts, and top posts.
- Export to CSV — downloads a
- The file will generate in the background. Smaller exports download almost immediately; larger ones (long date ranges or high post counts) may take a few minutes. A spinner will show while the file is being prepared so keep the tab open until the download starts.

Customizing your PDF export
When you choose Export as PDF, Buffer opens a short configuration step before the report generates. This works the same way on both the All Channels and single-channel Insights pages.
You can set:
- Report name: a custom title shown in the PDF header. Leave it blank and Buffer will use your organization name instead.
- Cover logo: upload your own logo to replace the default Buffer branding on the report's cover. Buffer saves the last logo you upload, so you won't need to re-upload it on your next export.
- Sections to include: every section is on by default. Uncheck anything you don't want in the final PDF.
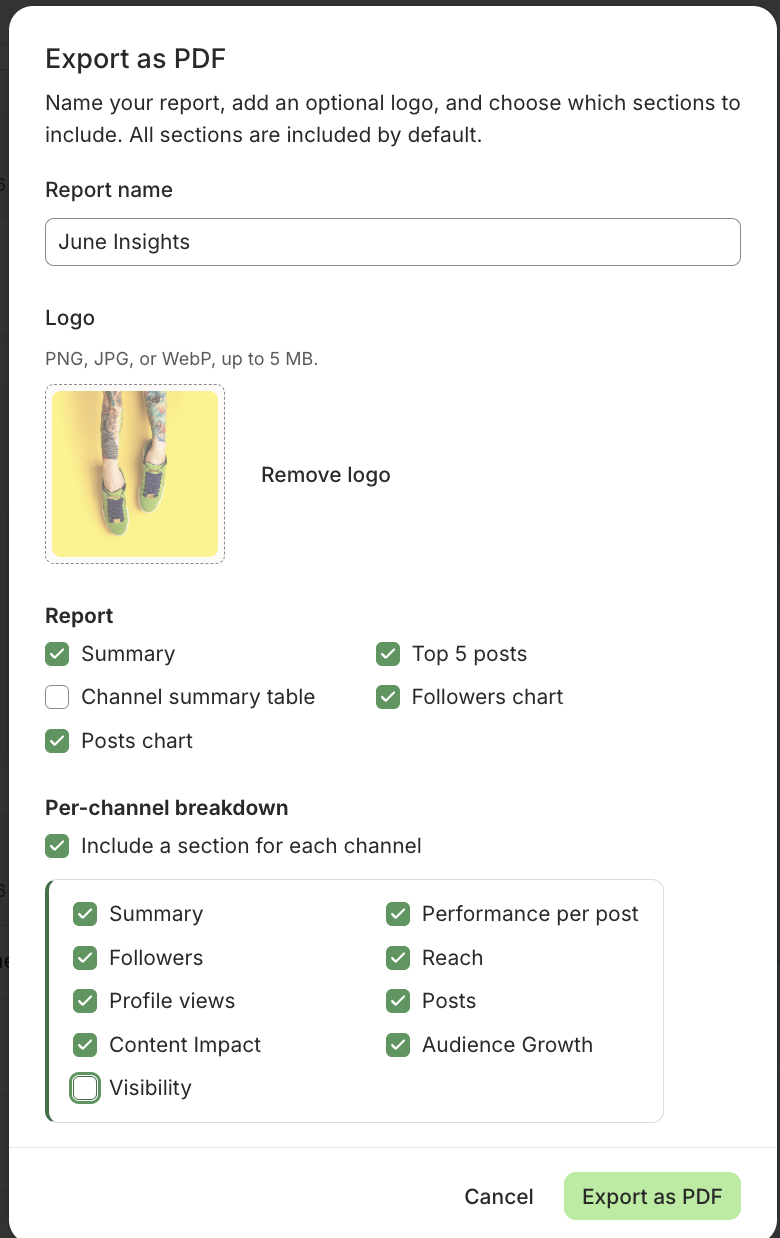
📝 Good to know: This configuration step only applies to PDF exports. CSV and Markdown exports run immediately, with no extra step.
What's included in the export
Both formats include data from all three Insights sections:
- Summary — each metric's current value and its percentage change vs. the previous period.
- Performance per Post — one row per post, including Post ID, published date and time, a post excerpt, post type (image, reel, carousel, video, etc.), post URL, any Buffer tags applied, and all available metrics for that channel (impressions, reach, reactions, comments, shares, saves, engagement rate, and so on). Only metrics that exist for the channel are included.
- Metrics Over Time — daily followers, posts published, and post views for the selected period.
📝 Good to know: Metrics included in the export vary by channel, just as they do in the Insights dashboard. You won't see empty columns — only the metrics your channel actually reports.
✨ Tip: If you want a different slice of your data, just update your filters and export again. Each export reflects the current state of your filters exactly.
Summary
The Summary section gives you a snapshot of how your channel performed during the selected date range, compared to another period of your choice.
Use the Compare to dropdown above the Summary grid to pick what to compare against:
- Previous Period — the same number of days immediately before your selected range (default).
- Same Period Last Week — the equivalent calendar window one week earlier. Best for short-range, week-over-week check-ins. (Unavailable when your selected date range is longer than 7 days.)
- Same Period Last Month — the same calendar dates one month back.
- Same Period Last Year — the same calendar dates one year back.
- Custom — pick any historical start date and Buffer will use a comparison window the same length as your current period. Dates that would overlap your current period, or dates in the future, can't be selected.
Each metric updates its comparison indicator (e.g. ↑ 28.6%) to reflect the period you've selected.
📝 Notes:
- The Compare to dropdown is currently available in Beta on single-channel Insights pages only. It does not appear on the All Channels view.
- Your comparison choice is now saved alongside the date range when you bookmark a view, so reopening a saved view restores both.
Followers table
The Followers table sits right at the top, showing your current followers and exactly how many you've gained (or lost) over your selected date range. We show that as a plain number, like +42, not a percentage, so you can see the real movement at a glance.
📝 Good to knows:
- Some networks only check in on your follower count every so often instead of daily. When that's the case, you'll see the most recent reading available for your selected period.
- If a channel doesn't report follower data at all, the Followers table will be hidden.
Available metrics
You'll see the following metrics:
- Posts — the number of posts published during the period
- Reactions — total likes/reactions received across all posts
- Comments — total comments received
- Impressions — total number of times your posts were displayed
- Shares — total shares
- Saves — total saves
- Follows — new followers gained during the period
- Reach — the number of unique accounts that saw your content
- Engagement Rate — the percentage of people who engaged with your posts out of those who saw them
Each metric includes a comparison indicator (e.g. ↑ 28.6%) so you can see at a glance how things have changed.

📝 Good to Knows:
- Not all metrics are available for every channel — it depends on what each social network shares through its API. For example, Saves may only appear for Instagram, and Reach may not be available for all networks.
- Note for LinkedIn posts: LinkedIn's API sends Buffer aggregated totals that can look higher than what you see in LinkedIn's own dashboard.
- Reactions includes reactions on other users' reposts of your content, in addition to reactions on your original post.
- Comments includes nested replies underneath top-level comments, not just top-level comments.
- This isn't a counting difference in Buffer — LinkedIn's analytics UI shows only direct engagement on the original post, while its API surfaces the fuller total.
Sharing your Summary as a post
On a single-channel Insights view, you can turn your Summary stats into a ready-to-publish post.
- Click the Share as Post button in the Summary section header.
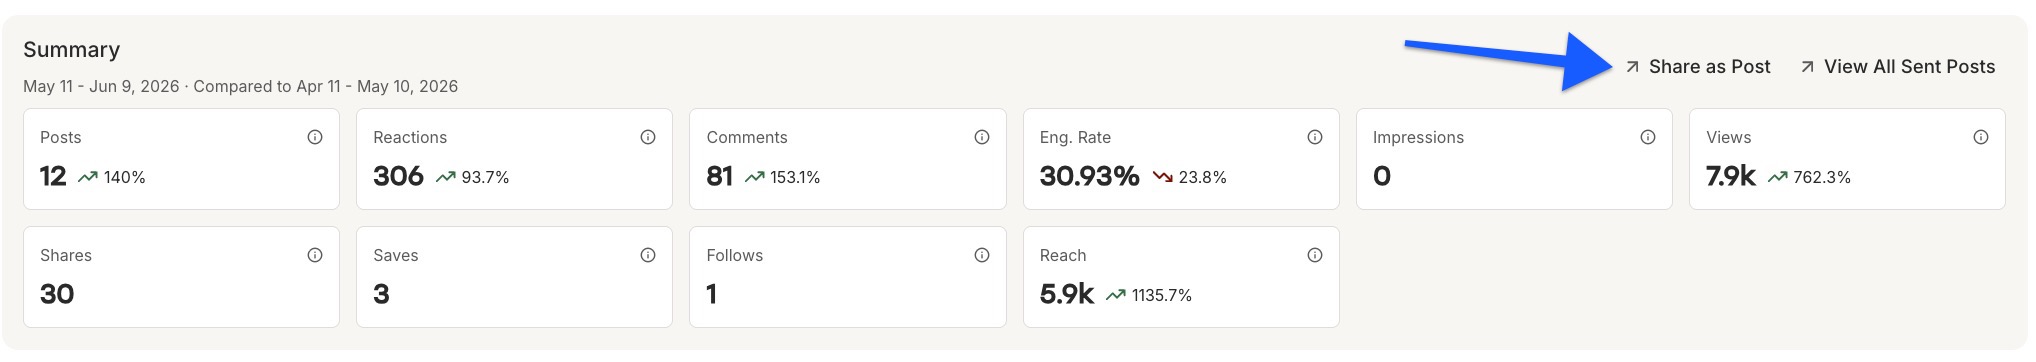
- This will generate a branded 1080×1080 image showing your top stats (reach, likes, replies, shares, etc.) with your channel's avatar and Buffer branding.
- Open the Post Composer with that image attached, alt text set, and a short caption pre-filled.
- Tweak the copy, choose which channels to post to, and schedule or publish like any other post.
📝 Good to know:
- Share Summary is only available on single-channel Insights. It doesn't appear on the All Channels view because there's no single channel for the post to default to.
- The image always uses a 1080×1080 square layout, which Instagram, X, LinkedIn, and Facebook all accept without further cropping.
- Up to 4 stats are shown on the card, picked from what's available for your channel (reach, likes, replies, shares-style metrics).
Performance per Post
The Performance per Post table breaks down how each individual post did during the selected date range.
For each post, you'll see:
- Post — a thumbnail and preview of the post content
- Eng. Rate — the engagement rate for that post
- Reactions — the number of likes/reactions for that post
- Comments
- Views
You can also rearrange the order of columns from the column selector, like this:
💡 Tip: Your top posts by engagement rate are a goldmine for content inspiration. Look for patterns in format, topic, or timing and lean into what's clicking with your audience.
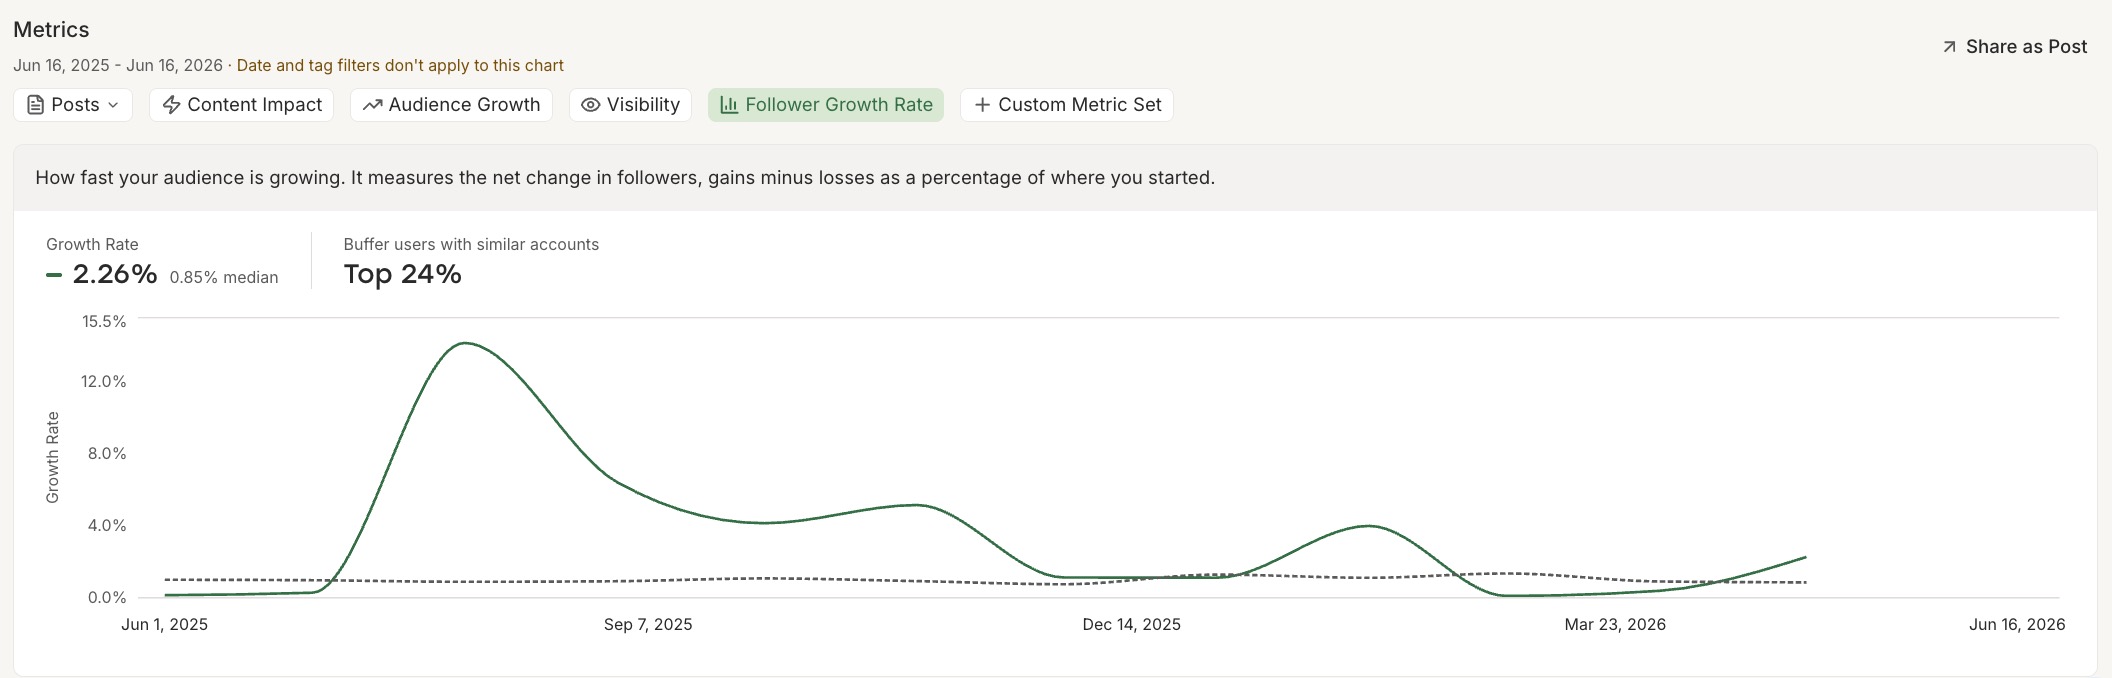
Metrics chart
The Metrics section shows a line chart of a metric over your selected date range. Note that date and tag filters do not apply to this chart — it always shows data for the full year regardless of the date range selected elsewhere in Insights.
When you open a channel, the chart opens on Content Impact by default, layering your posts on top of your follower growth so you can see how the two track together. Want a different view? Grab one from the buttons below. The default flips back to Content Impact each time you switch channels.
📝 Note: No follower data for a channel? The chart opens on Posts instead.
A set of curated view buttons sits above the chart, each designed to answer a specific question about your channel's performance:
- Posts — how often you published during the selected period.
- Content Impact — your post volume alongside follower growth, side by side.
- Audience Growth — followers over time, plus net new followers gained.
- Visibility — profile views compared against your follower count.
- Follower Growth Rate (LinkedIn channels only) — your monthly follower growth rate benchmarked against similar Buffer accounts. See the callout below for details.
- + Custom Metric Set (available on paid plans) — build your own view by selecting the metrics you want to track together.
Selecting a button updates the chart automatically. You can also use the metric dropdown (e.g. Followers) directly above the chart to switch to any individual metric available for your channel.
📝Notes:
- The Visibility tab (profile views) is only shown for networks that report views data. It's hidden on Bluesky, X/Twitter, and Mastodon channels — those networks only report follower counts at the channel level, so there's no views data to display.
- The Follower Growth Rate benchmark is available on LinkedIn channels only. It plots your monthly follower growth rate over time and compares it against the median for a cohort of similar Buffer accounts, showing you a percentile rank so you can see where you stand relative to comparable pages.
- What counts as a "similar account"? The cohort is matched on two things: channel type (pages are compared to pages, profiles to profiles) and approximate follower count. It's scoped to other LinkedIn channels connected to Buffer — not LinkedIn as a whole.
How channels show up in the chart
By default, in the All Channels view, the Metrics chart shows your first 5 channels. Apply the channel filter at the top of the page, and the chart switches to your selected channels, drawing up to 10 at a time. When more channels exist than the chart can show, you'll see an inline notice ("Showing X of Y channels. Filter by channel to see a different set.") in the section subheading.
📝 Note: Some metrics aren't available for every channel. If a channel you've selected doesn't report the metric you're viewing, for example Pinterest doesn't report followers, you'll see a notice like "Pinterest profiles don't report followers, so they are excluded from this chart," and that channel won't be drawn.
Follower breakdown views (All Channels)
The All Channels Metrics area is split into two stacked cards — Followers on top and Posts below.
In the All Channels view, the Followers metric has its own view toggle so you can choose how to look at follower counts:
- By channel — a ranked bar chart, one bar per channel, sorted by current followers. The solid base shows where you started or ended (whichever is lower), and the coloured segment on top shows the change for the period. The label at the top of the bar shows current followers and the change in brackets (e.g. "12,340 (+128)"). Use this to see which channels are biggest and where the largest movement happened.
- Growth — a diverging bar chart of net change per channel, sorted gains-first. Bars are coloured by direction — green for gains, red for losses — so you can spot at a glance which channels grew and which shrank. The channel-colour legend isn't shown in this view because colour is being used to mean direction here.
- Over time — the standard line/area chart of followers across the period (this is the same view you've had before).
Posts has its own toggle too — see Posts chart (All Channels) below.
📝 Notes:
- Hover over the Followers chart to see each channel's status for that day: a number for a live reading, "As of [date]" for a carried-forward value from the channel's most recent data, or "No data available" if the channel doesn't have a reading yet.
- If you choose a date range that starts before a channel is connected, hovering over a date prior to connecting the channel will show "No data available" for the affected channel.
Posts chart (All Channels)
Below the Followers table the Posts chart has its own Bar / Stacked Bar toggle:
- Bar (default) — a horizontal ranked chart, one bar per channel, showing total posts over the selected date range, sorted from most to fewest. Best for seeing at a glance which channel you posted to the most.
- Stacked Bar — vertical bars over time, with each day broken down by channel. Best for seeing when you posted most across the range and how that activity splits across channels.
📝 Good to know: Share as Post on the Posts table captures whichever view is on screen, including the ranked Bar view. This differs from the Followers table above, where Share as Post only captures the Over Time chart even if you're viewing By channel or Growth.
Comparing periods
Use the Compare dropdown to overlay data from an earlier period. Five options are available:
- Previous Period — the same number of days immediately before your current date range. Best for short-term trend checks (e.g. comparing this week to last week).
- Same Period Last Month — the equivalent calendar window one month earlier. Best for monthly reviews where month-over-month progress matters more than seasonality.
- Same Period Last Year — the equivalent calendar window twelve months earlier. Best for year-over-year reporting and tracking seasonal trends.
- Same Period Last Week — the equivalent calendar window one week earlier. Best for short-range, week-over-week check-ins. (Unavailable when your selected date range is longer than 7 days.)
- Custom (paid plans only) — pick any historical start date and Buffer will use a comparison window the same length as your current period. Dates that would overlap your current period, or dates in the future, cannot be selected.
A toggle in the top right of the chart lets you control what's displayed:
- — This Period — shows only your current date range (solid line).
- -- Comparison — shows only the comparison period (dashed line).
- Both — overlays both periods on the same chart.
Hover over any toggle option to see a tooltip with the exact date range it covers, so you always know which window is which.
Your comparison choice is saved in the URL, so you can bookmark or share a specific view.
💡 Tip: Combine the channel filter with the Tags filter to see how a specific content category performed across your selected channels.
Takeaways
The Takeaways section provides AI-powered observations about your recent content performance. Unlike the Summary and Metrics chart, Takeaways are not affected by the date range selector. They reflect a broader view of your content performance and stay consistent as you explore different time windows in the chart above.
Use Takeaways alongside the date-filtered chart to get both the big-picture story and the granular trend data at the same time.

Takeaways can include a mix of the following:
- Performance tips highlight patterns in your content — things like which formats are resonating, what topics are driving engagement, and trends worth repeating.
- Repost suggestions identify your best-performing older posts and suggest republishing them to extend their reach.
- Start with AI cards are interactive. Click one to open the post composer with the AI Assistant panel already active and a prompt pre-filled based on what's been working for you. You can tweak the prompt or run it as-is, then schedule the resulting post like any other.
Note: The repost takeaway only appears for channels with posts older than four weeks and is not currently available for Bluesky or Mastodon channels.
Sharing feedback on Takeaways
Each Takeaway card has a thumbs-up and thumbs-down button in its header. Click thumbs up if a takeaway felt useful, or thumbs down if it didn't — your feedback helps us tune which kinds of Takeaways you'll see in future. Your selection stays highlighted so you can see at a glance which cards you've already rated. Change your mind? You can click again to unselect your choice.
On smaller screens, the feedback buttons sit just below the category icon, with the title underneath. On wider screens, they tuck into the right side of the card header and appear when you hover or focus on the card.
Supported channels
Insights is available for all channels connected to Buffer, including:
- Instagram (Professional accounts — Business or Creator)
- Facebook Pages
- X/Twitter
- LinkedIn Pages and Profiles
- TikTok
- Threads
- Bluesky
- YouTube
- Mastodon
📝 Good to Know: The metrics available in Insights will vary depending on the channel. Each social network controls what data it makes accessible through its API, so you may see different metrics for different channels.
Good to Knows
- The numbers may differ from your native analytics. Small discrepancies between what you see in Buffer and what you see in Instagram, Facebook, or other native dashboards are completely normal. Each platform calculates and updates data in its own way.
- Insights and Analyze are separate tools. Insights is your quick per-channel check-in. For deeper reporting (e.g. multi-channel comparison, audience demographics, stories analytics, custom reports, and more) head to Analyze via the link in the top right of the Insights dashboard.
- Historical data availability varies by channel. When you first connect a channel, Buffer backfills data going back a set period. Here's what to expect:
| Channel | Backfill period |
|---|---|
| 30 days of post data; 6 months of channel-level data | |
| Instagram (Professional) | 30 days of post data; stories collected from connection date onwards only |
| X/Twitter | 30 days of post data; no channel-level data available |
| LinkedIn Pages | 30 days of post data; 6 months of channel-level data |
| TikTok | 60 days |
| Threads | 60 days |
| 90 days | |
| YouTube | 90 days |
| Bluesky | No backfill — data collected from connection date onwards only |
| Mastodon | No backfill — data collected from connection date onwards only |
If you're not seeing historical data you expected, reach out to our team at hello@buffer.com.
⚠️ Instagram Personal accounts have limited data. To get the full range of metrics in Insights for Instagram, you'll want your account connected as a Professional (Business or Creator) account. Personal accounts have restricted API access. See Connecting your Instagram account to Buffer for more details.
FAQ
How far back can I view data?
You can use the preset date ranges:
- Last 7 days,
- Last 30 days
- Month to date
- Last month (paid plans)
or set a custom range (paid plans only).
How far back data goes depends on the channel — for example, Facebook and LinkedIn Pages backfill 6 months of channel-level data and 30 days of post data when first connected, while Instagram and X/Twitter backfill 30 days of post data. Check the Historical data availability table in the Good to Knows section above for a full breakdown.
How is engagement rate calculated?
Engagement rate is based on the interactions a post received (likes, comments, shares, etc.) relative to how many people saw it during the selected period.
📝 Note for LinkedIn profiles: Reshare data isn't available at a reliable level of accuracy for LinkedIn profile posts, so Buffer uses (reactions + comments) / impressions for the engagement rate on those posts. LinkedIn Page posts are unaffected — they use the engagement rate LinkedIn itself reports, which includes shares.
Why don't I see all the metrics listed?
Not every metric is available for every channel. If something isn't showing up, it's because that social network doesn't share that data through its API. Nothing's broken, it just varies by platform!
My Insights numbers look different from what I see in the native app — is that normal?
Totally normal! Differences in how and when each platform processes data can cause the numbers to vary.
I need more detailed analytics — where should I go?
Head to Analyze — there's a link in the top right of the Insights dashboard. You'll find multi-channel overviews, audience data, stories analytics, custom reports, and more.

Can I export my Insights as a PDF?
Yes! Click the Export button at the top of the page and choose Export as PDF. You'll first see a short configuration step where you can set a report name, upload a cover logo, and pick which sections to include. Once you confirm, the export runs in the background and generates a branded report. Single-channel exports include a cover page, Summary metrics, Metrics-over-time charts, and a Performance per Post table. All Channels exports include an aggregated Summary, Top Posts by Reactions and Comments, a per-channel Performance table, and a detailed section for each connected channel.
How do I share feedback about Insights?
We'd genuinely love to hear from you! Since Insights is in Beta, your feedback directly shapes where we take it next. Hit Share Feedback in the top right corner of the Insights dashboard to send us your thoughts.
Can I save my Insights view?
Yes — click the bookmark icon next to the filter controls to save any combination of date range, comparison, channels, and tags as a named view. All preset date ranges plus Custom are saveable, both on single-channel and All Channels pages. Learn more about saving custom views in Buffer here.
Need help with Insights? Send us an email at hello@buffer.com and our Advocacy team will be standing by to help.