Getting started with Buffer's analytics features
Once your Buffer posts have been published, it's time to see how they landed with your audience. Buffer's analytics feature is called Insights. It gives you a quick, lightweight view of your performance, right inside Buffer, so you can check on follower growth, engagement, and impressions without ever leaving your publishing dashboard.
⭐️ Insights is free to use on all plans. Some options, like the Last month and Custom date ranges and data exports, are available on paid plans only.
In this article:
- Video: Getting Started with Buffer's Insights
- Overview of Insights
- Filtering and exporting your data
Video: Getting Started with Buffer's Insights
Watch the video below to learn more about Buffer's Insights.
Overview of Insights
Insights gives you two ways to check on your performance: a birds eye view across all your channels, or a closer look at one channel at a time.
All Channels view
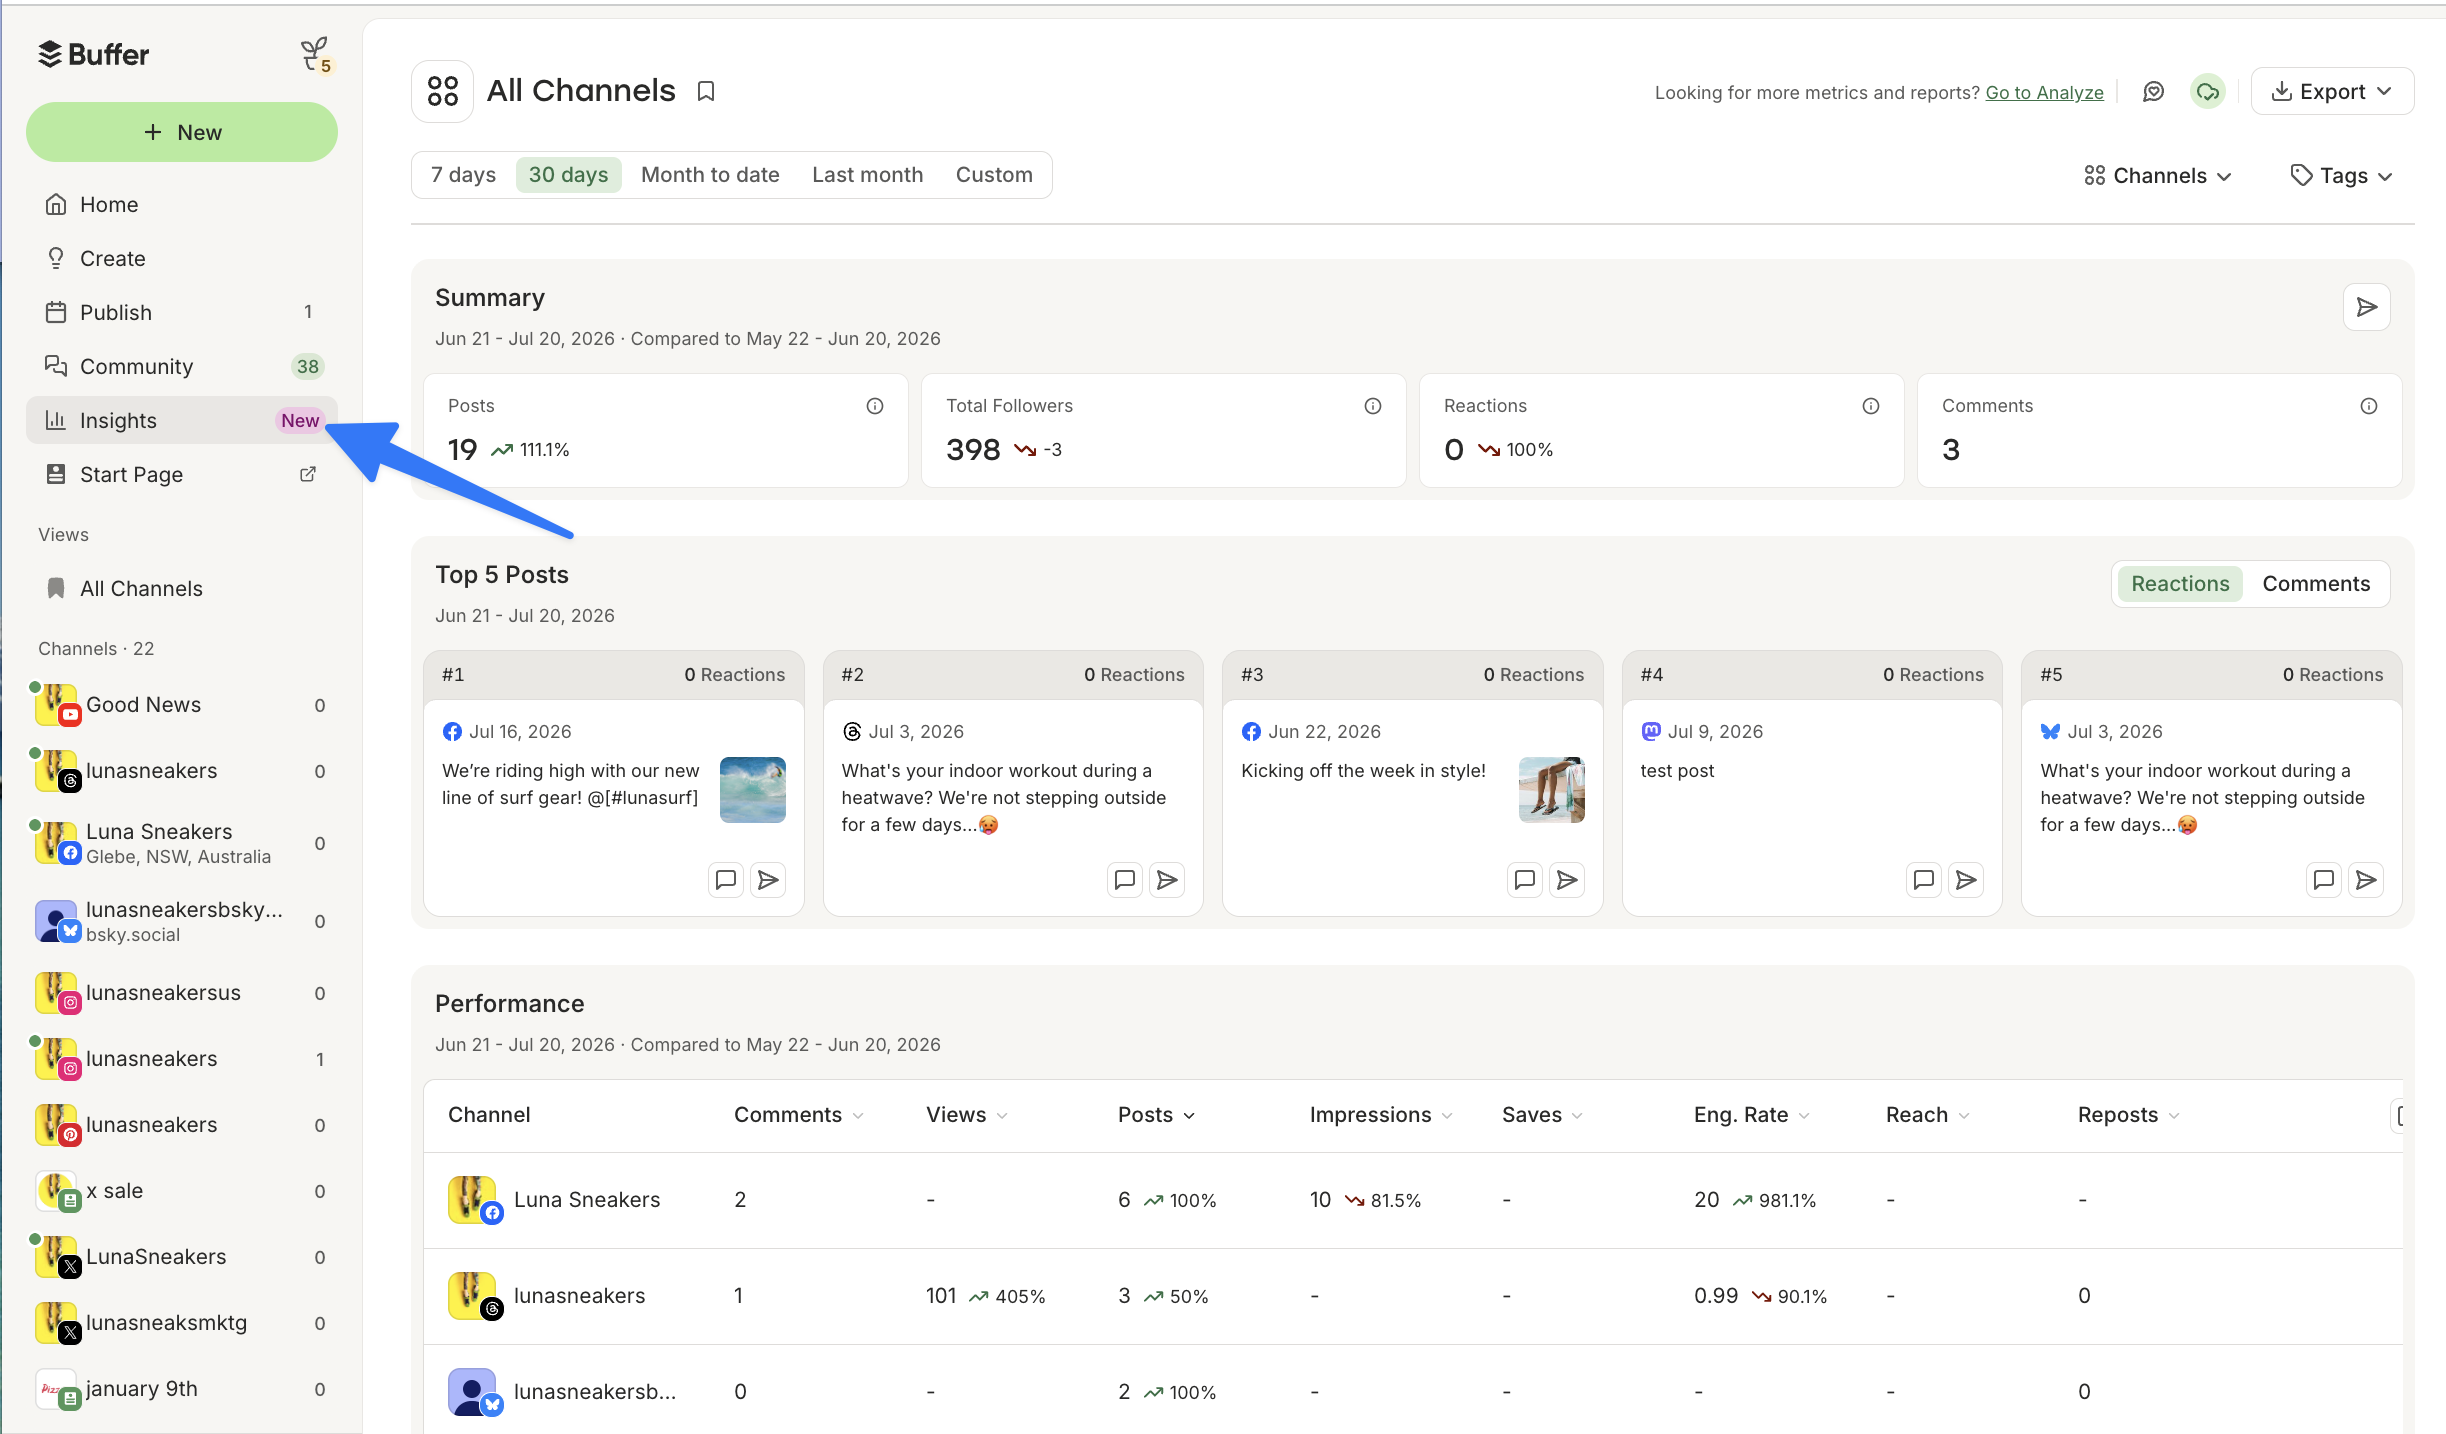
Click Insights in the left sidebar of the web dashboard to see an overview across every channel you've connected. This is the fastest way to spot which channels are growing and which posts are performing best, without switching between accounts.
Single channel view
To focus on one channel, select it in the left sidebar, then click Insights beneath the channel name. You'll land on a dashboard for that channel showing follower growth, engagement, reach, impressions, and a table of your top-performing posts.
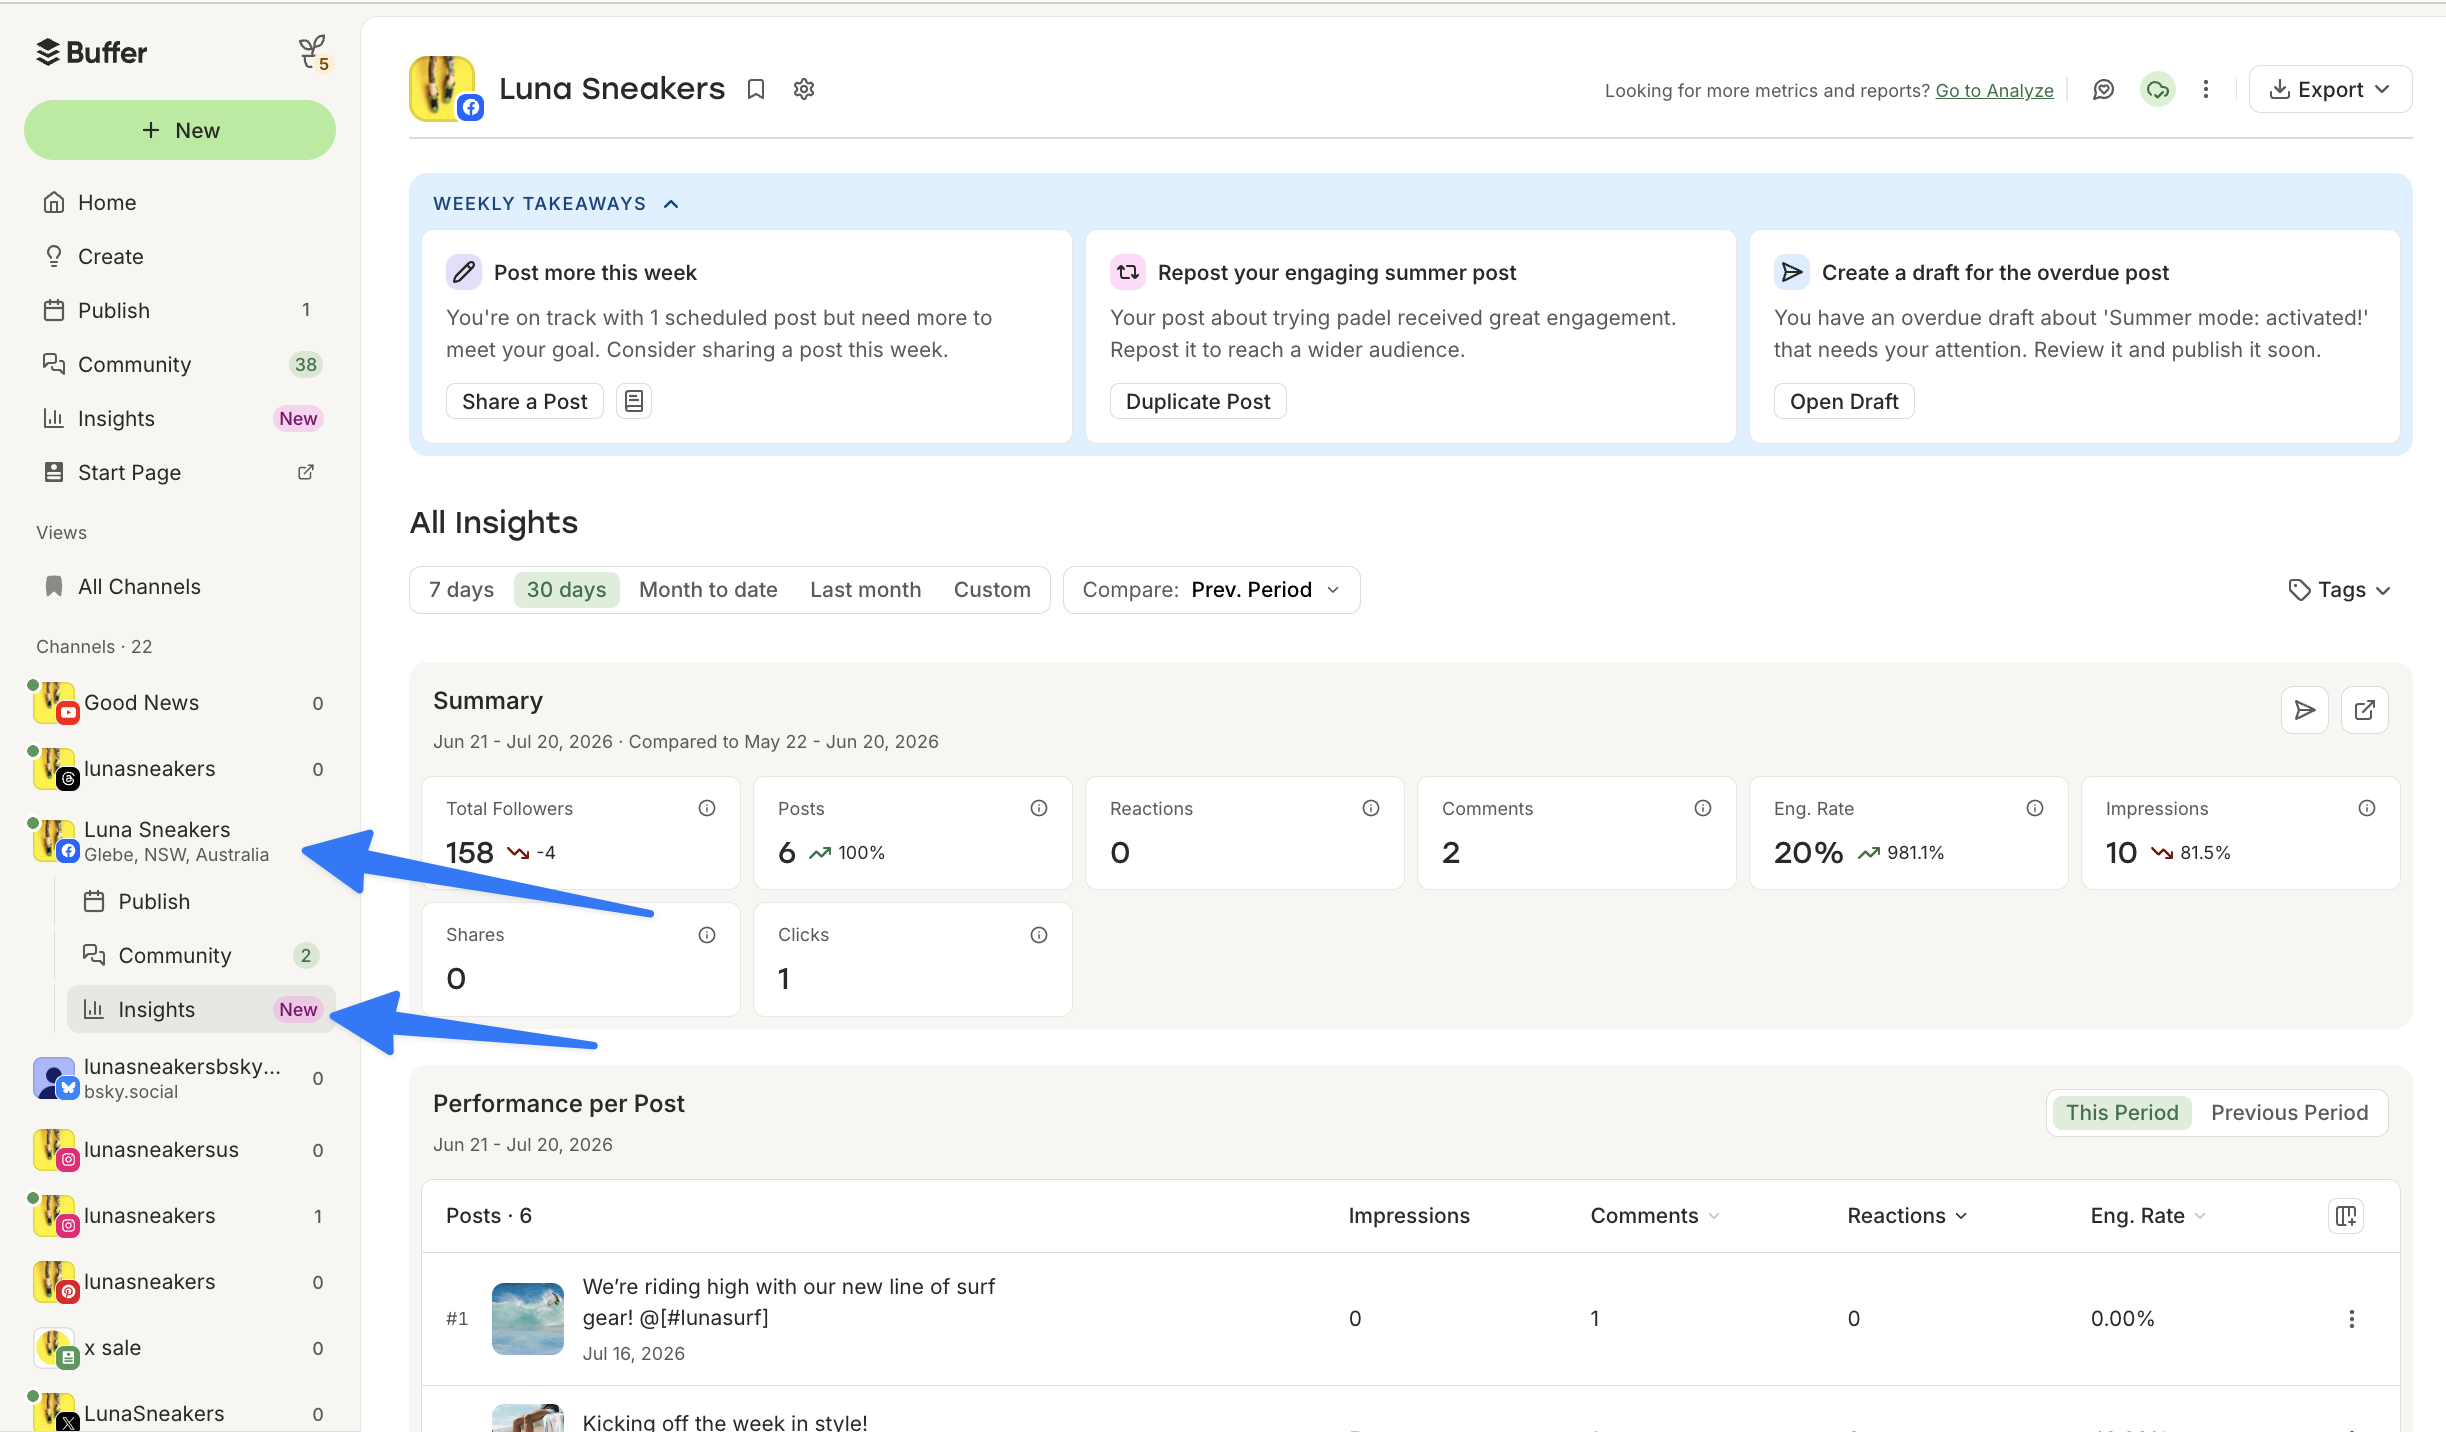
By default, Insights shows the last 30 days, but you can adjust the date range using the options at the top of the page. Available ranges include: Last 7 days, Last 30 days, Month to date, Last month (paid plans), and Custom (paid plans).
💡 Tip: Insights also surfaces AI-powered Takeaways, short observations about what's working in your recent content, so you don't have to piece the story together yourself.
Filtering and exporting your data
From either view, you can filter your Insights by Tags to focus on a specific campaign or content theme. In the All Channels view, you can also filter by Channels to narrow things down to a subset of your accounts. Both filters are shown in blue, below:
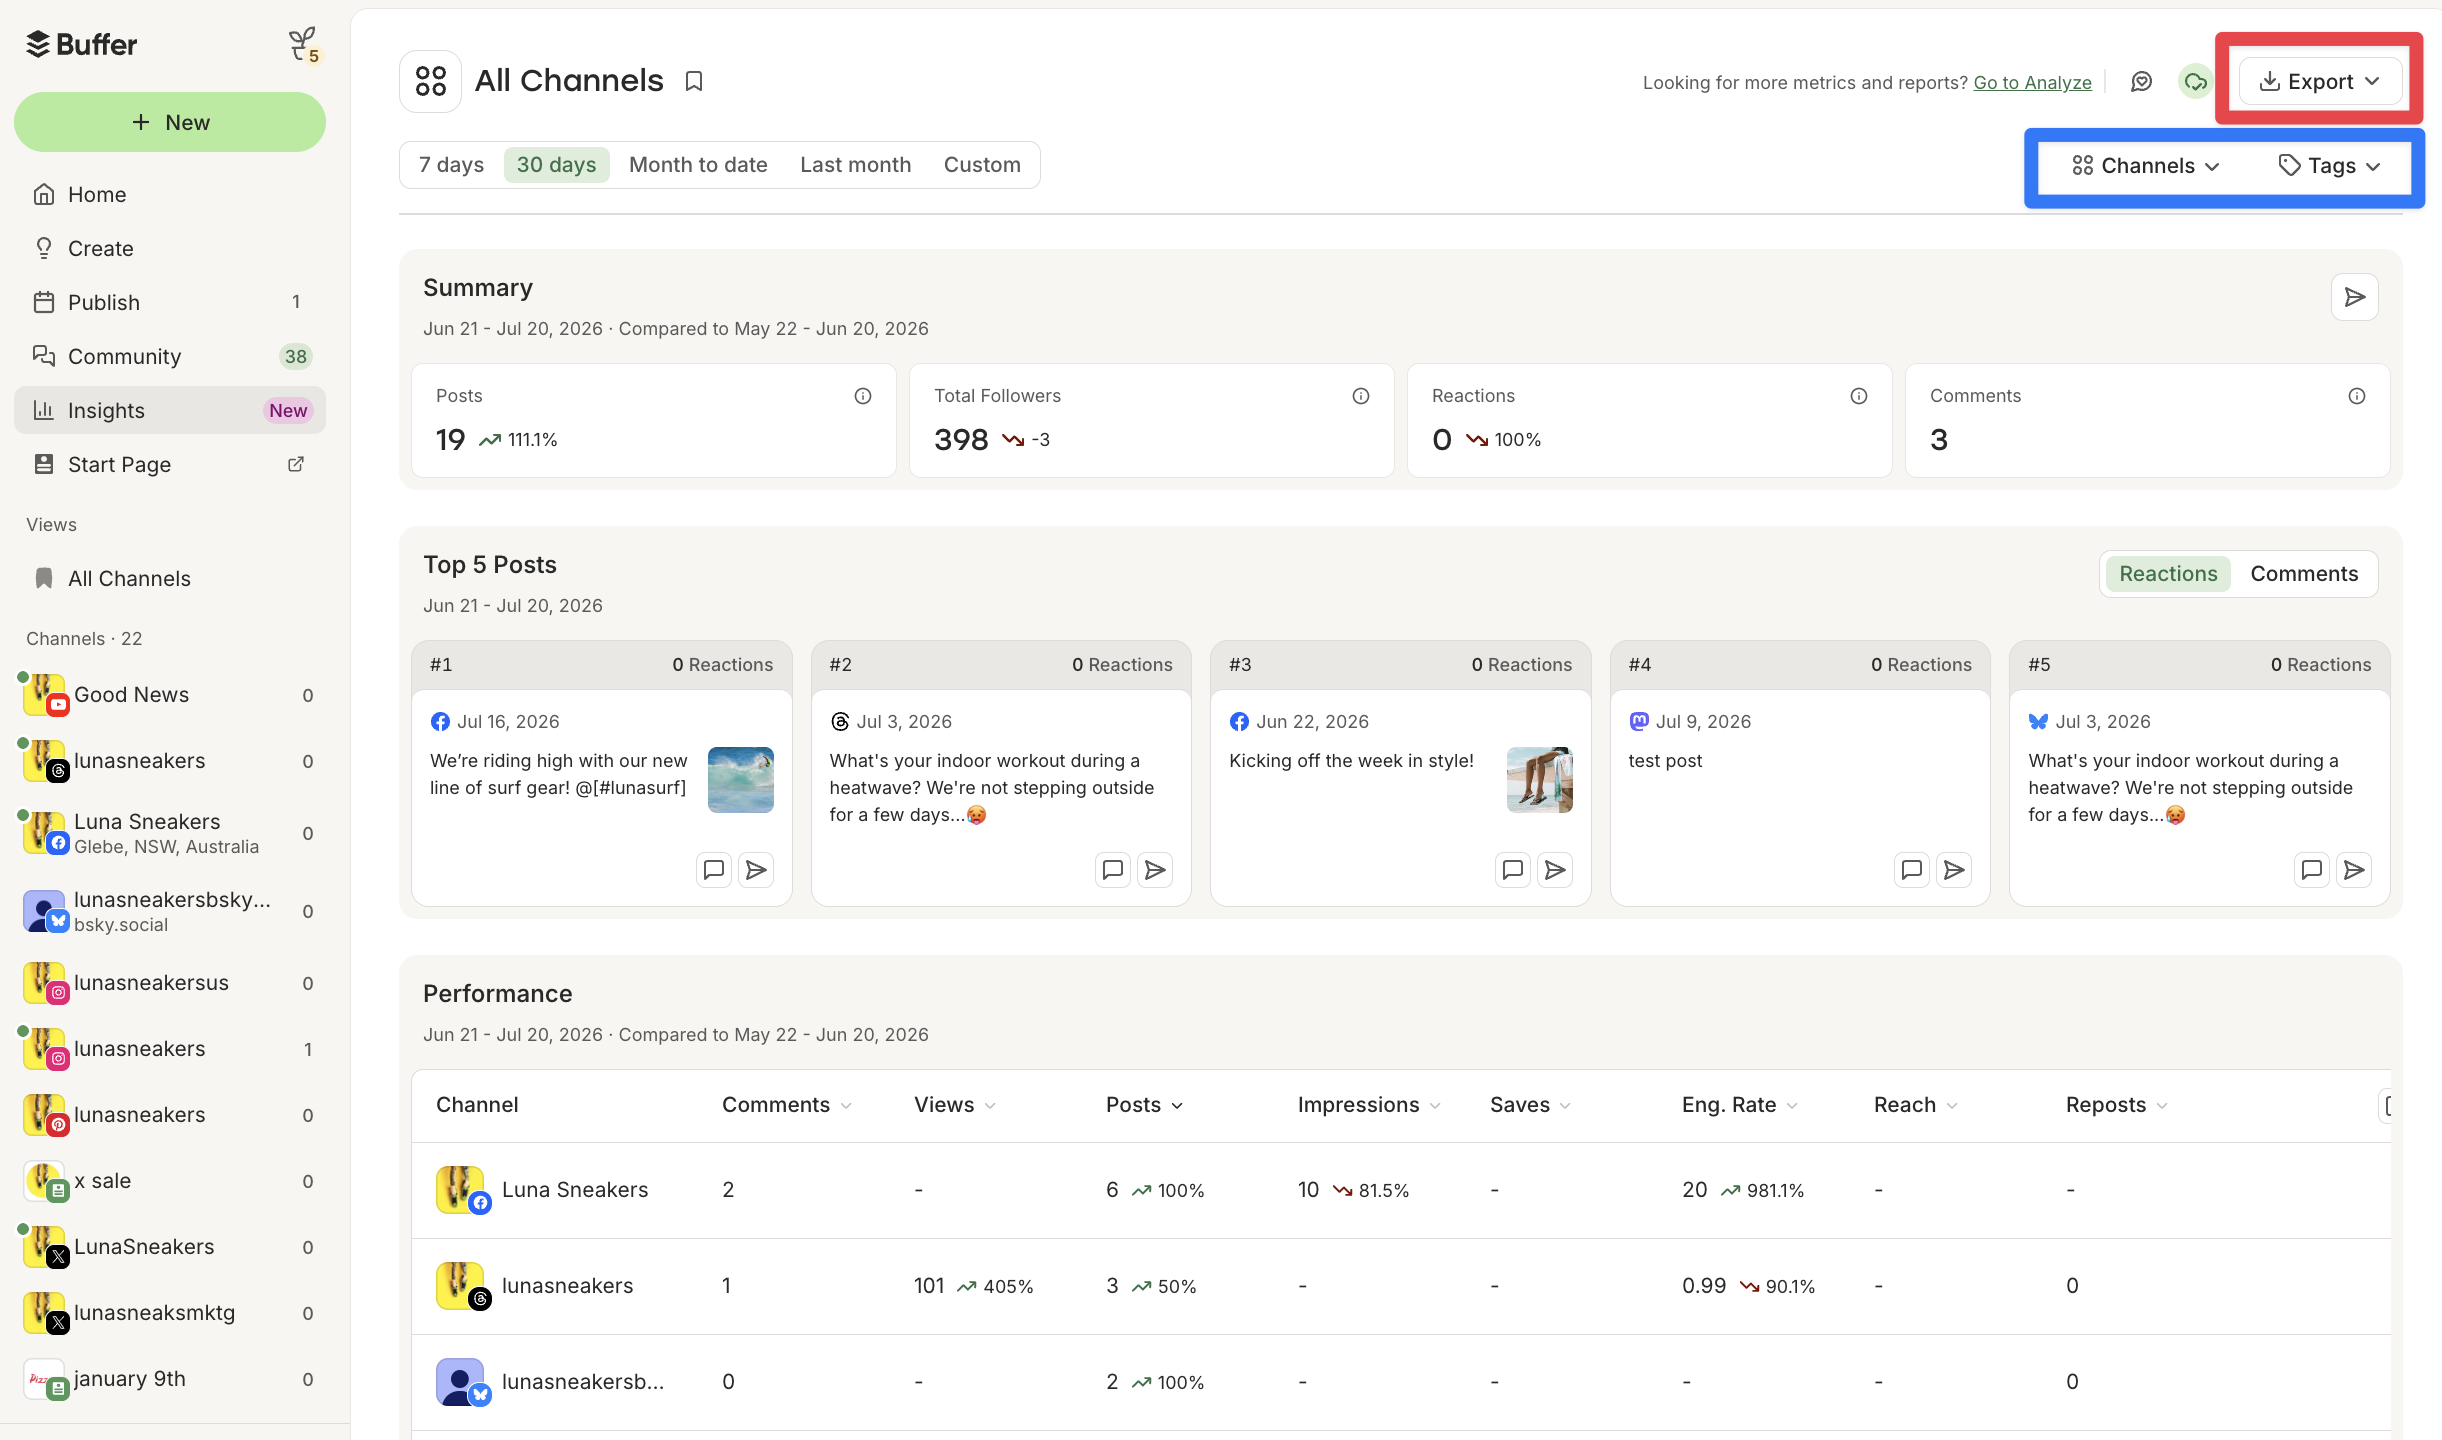
⭐️ On paid plans, you can export your Insights data as a CSV, Markdown file, or branded PDF report, useful for sharing progress with your team or clients (shown in red above).
📝 Ready to dive deeper into Insights, including exporting, comparing time periods, and Takeaways? Check out our full guide: Using Insights in Buffer.
More resources from our blog
- Social Media Metrics You Should Be Tracking (And Why)
- The Best Time to Post on Social Media, Backed by Data
- Social Media Engagement: Why it Matters
- How to Create a Social Media Marketing Strategy
📝 Need help with Insights? Send us an email at hello@buffer.com and our Advocacy team will be standing by to assist!